
Take the weather outside today: cumulus clouds gather over the Catalina Mountains to the north, and a breeze blows in from the Pacific. Homes on the northwest side of Tucson are now in the shade, while to the southwest and southeast, the sun shines through unimpeded.
According to UA physics post-doctoral researcher Dr. William Holmgren, this is one of those rare days when clouds actually increase solar productivity in small areas for short periods of time, acting as reflectors for the direct sunlight that makes its way through clear parts of the sky. And that, according to Holmgren, is just one of the many reasons that refining our ability to forecast solar and other renewable energy productivity is both complicated and critical to widespread implementation.
When solar was first coming onto the market, Tucson Electric Power (TEP) came to the UA for help testing manufacturer promises. The incorporation of solar power was imminent for reaching the state mandate of generating 15% of their energy from renewable resources by 2025, and they wanted to be smart about their approach.
“One of the greatest challenges eight years ago was understanding how the different types of solar energy technology performed,” said Ardeth Barnhart, director of UA’s Renewable Energy Network (UA REN), a university-wide initiative that works to connect the energy industry to research at the UA.
Now, Barnhart said, since solar is more affordable and the technology has evolved, the greatest challenge is figuring out how to incorporate solar and other clean energies into the grid.
While renewable energy forecasting is just one of the many initiatives supported through UA REN, it’s a particularly important and tricky one—tricky due to the intermittent nature of renewables: solar only produces power when it’s sunny, wind, when it’s windy.
Because of these complications, utilities like TEP and Arizona Public Service (APS) came to the UA with this question: how do we integrate renewables more reliably into the grid? One crucial part of the answer: better information about how much renewable energy is is going to be available, and when. In order to provide that information, researchers from UA’s Atmospheric Science and Physics Departments, led by Holmgren, teamed up to answer these questions and provide both raw data and comprehensive renewable power forecasts to the utilities. The team is comprised of Dr. Eric Betterton from atmospheric science, atmospheric meteorologist Dr. Mike Leuthold, and Physics Professor Dr. Alex Cronin.
“The key to this is really the regional expertise,” Barnhart said. “APS used to license a commercial software package and they stopped doing it and are relying solely on UA forecasts because they’re far more accurate.”
The forecasting tools that these regional experts offer are appealing to the utilities for a multitude of reasons, but simply put, Ted Burhans, TEP’S Manager of Renewable Energy Resources, said “What the weather forecasting allows us as a utility to do is effectively integrate renewable technology onto the grid while maintaining, safe, reliable and affordable services for our customers.”
Here’s how forecasting helps utilities plan and save consumers money:
Imagine it’s summer in Phoenix. Everyone runs their AC, and many of the energy plants are operating at capacity. Then, something happens: a power plant goes offline or transmission line fails. Usually, there’s enough slack in the entire western US (the energy grid we’re linked to here in the Southwest) to avoid a brown-out or black-out. But, the utility in the area (say APS, in this case) is responsible for the shortage and is suddenly on the hot seat because it’s not meeting its demand. It either has to come quickly back into compliance (which could mean purchasing costly power from elsewhere), or face significant fines. This scenario is expensive, and exactly the kind of thing utilities are eager to avoid. Having information and understanding the way renewables are contributing to the grid, and when, helps them do exactly that.
Holmgren said APS was faced with this challenge last summer. Watching energy consumption spike during a hot afternoon and wanting to avoid any potential problems, it was considering purchasing extra energy, but doing so would be expensive. Holmgren’s team, however, forecasted a high likelihood of a thunderstorm and a temperature drop that would compel people to turn down their AC.
“Due to our forecast, they avoided the need to purchase expensive energy,” Holmgren said. “That’s the way these forecasts show up on your utility bill: in the fact that they didn’t need to do something really expensive.”
While providing a renewable energy forecast to utilities may sound simple on the surface, it isn’t. Researchers have been working on this tool for years now, and it’s a complicated puzzle.
Solving the forecasting puzzle in three, not-so-simple steps:
1. Short-term (1-3 minute) forecasts called “now casts” or “network forecasts”:
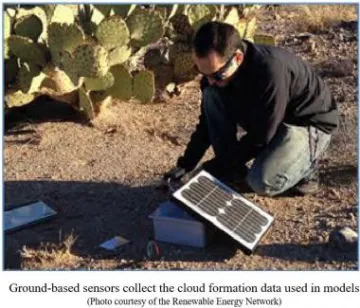
UA researchers developed a more accurate model for “now casts” by teaming up with a Tucson business, Technicians for Sustainability, to gather real-time data from rooftop solar units. This information is paired with data coming from irradiance sensors out in the desert and around town, and also with data from large photovoltaic (PV) solar plants in order to anticipate solar output. “We combine all these different data sources, which are primarily dependent on how much sunlight there is, into one network of real-time-data to make accurate forecasts,” Holmgren said. “This particular method works, to our knowledge, better than any other method for providing that short-term forecast.”
2. Medium-term (1-2 hour) forecast —“the satellite method”:
Satellites observe the amount of light reflected from the surface of the earth or the top of clouds. What utilities like TEP and APS want to know is how much light is making it to their solar panels. So, UA scientists developed an algorithm that calculates how much light is transmitted through clouds to the earth’s surface and can track the speed of the clouds to estimate their arrival time in a given region. “We essentially take satellite images and run them through the algorithm so we have a pretty good idea of how much light is going to make it through, but there’s still some uncertainty,” Holmgren said. New work by graduate student Tony Lorenzo, from the College of Optical Sciences, pairs the satellite calculations with the same real-time data used for the short-term forecasts to identify and address those uncertainties.
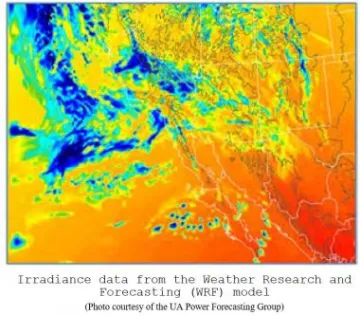
3. Long-term forecasting called “the weather model”: The UA REN team uses an open source
weather prediction system (the Weather Research and Forecasting model) that is configured for forecasts in the Southwest U.S. These systems predict weather by applying a numerical grid to the region, and then solving the equation of the specific algorithms for each grid cell. In the mid-west, the grid doesn’t need to be especially fine because the landscape is relatively uniform. In Arizona, however, that isn’t the case.
“Here in the Southwest we have mountains that rise pretty sharply from the deserts, so resolution is important. Forecasts of clouds get a lot better with higher resolution, so for solar that’s important,” said Holmgren.
The team collects all of this information, then processes and makes it available to subscribing utilities like APS and TEP. The forecasts are made available in raw form so utilities can integrate it into their own systems and models, as well as in forecasts and other graphic models that can help the utilities identify trends and gaps.
Perhaps most importantly, the data helps utilities begin to see how renewable energy can be consistently and strategically incorporated into the grid with minimal risk.
“It’s very exciting to be part of something that’s fundamentally changing grid management and how the grid is operating,” Burhans said. “The utility industry has been around for over 100 years and its hard to change the direction of a big moving ship like that, so it’s pretty cool to be a part of that.”
When Holmgren originally sought funding for the forecasting research he found it was too applied for basic science agencies like National Science Foundation (NSF), and too experimental for the private sector, making it difficult to find funding. But, through the UA REN, the team received TRIF funds to support initial investigations. The data, established teams, and productive findings from that early research made it possible for Holmgren and others to compete for additional support.
“In 2014, I wrote a proposal to the DOE’s Energy Efficiency and Renewable Energy (EERE) program saying ‘hey, we have a unique opportunity here in the Southwest to combine state-of-the-art forecasting methods into one great forecast and do it in one of the places where it matters most,” Holmgren said. Now, Holmgrens’ position is funded by a two-year post-doctoral fellowship from the DOE, and ongoing support from the utilities.
In addition to providing essential start-up costs for the research, as well as funding for the many computers required for processing the immense amount of data associated with high resolution weather models, TRIF funds provide support for other members of the team.
“UA REN supported me through summer fellowships and the opportunity to attend various conferences. And, of course, they help contracting the utilities, which ultimately funds my position,” said Lorenzo, who works with Holmgren and the team in multiple capacities, but most specifically on the mid-term forecasts.
“The future of this is very bright,” Holmgren said. “There’s only going to be more solar and wind in the Southwest as the price continues to come down and as utilities and people get more used to seeing it, which makes forecasts for solar and wind generation all the more important.”
UA REN is interested in providing research and forecasting tools that extend beyond renewable energies.
“The future of this is to start incorporating seasonal forecasts that include climate information like heat and water availability so we can extend the forecast to farms and water utilities. We want to expand so we’re not just looking at energy, but looking at every part of the water-energy-food nexus,” Barnhart said.